Would you like to know more about LinkedIn’s user demographics, mobile traffic, and LinkedIn’s visitor statistics broken down by country, city, and state?
How about real-time LinkedIn unique visitors and page views per second?
http://youtu.be/hvd7riHUFM8
If so, you’ve come to the right place!
I originally posted LinkedIn’s traffic, user statistics and demographics data in 2010 and again in 2011. After taking about 2 years off, I decided it was time to share the latest information on LinkedIn, including mobile user statistics unavailable in the past.
In this post, I will compare the data from 2010 and 2011 with the data I just pulled from Quantcast, which – aside from beyond totally awesome – is used by 9 of the top 10 media agencies because they are so accurate in quantifying Internet audiences.
While some sites are not directly measured and only have estimated data at this time (such as Facebook and Twitter), LinkedIn is fully “quantified.”
![]()
![]()
In other words, Quantcast directly measures LinkedIn’s visitors – which gives us great information and some very interesting insights!
For example, you can see the dramatic increase in daily uniques and the onset of mobile use:

Read on to see the following LinkedIn data:
- Global monthly visitors
- Global monthly visits
- Visits per person
- Pageviews per person
- Visit frequency
- Mobile statistics – NEW!
- User demographics (gender, age, ethnicity, income, education level)
- Monthly visitors by country
- Monthly visitors by city (global)
- Monthly visitors by state (U.S.)

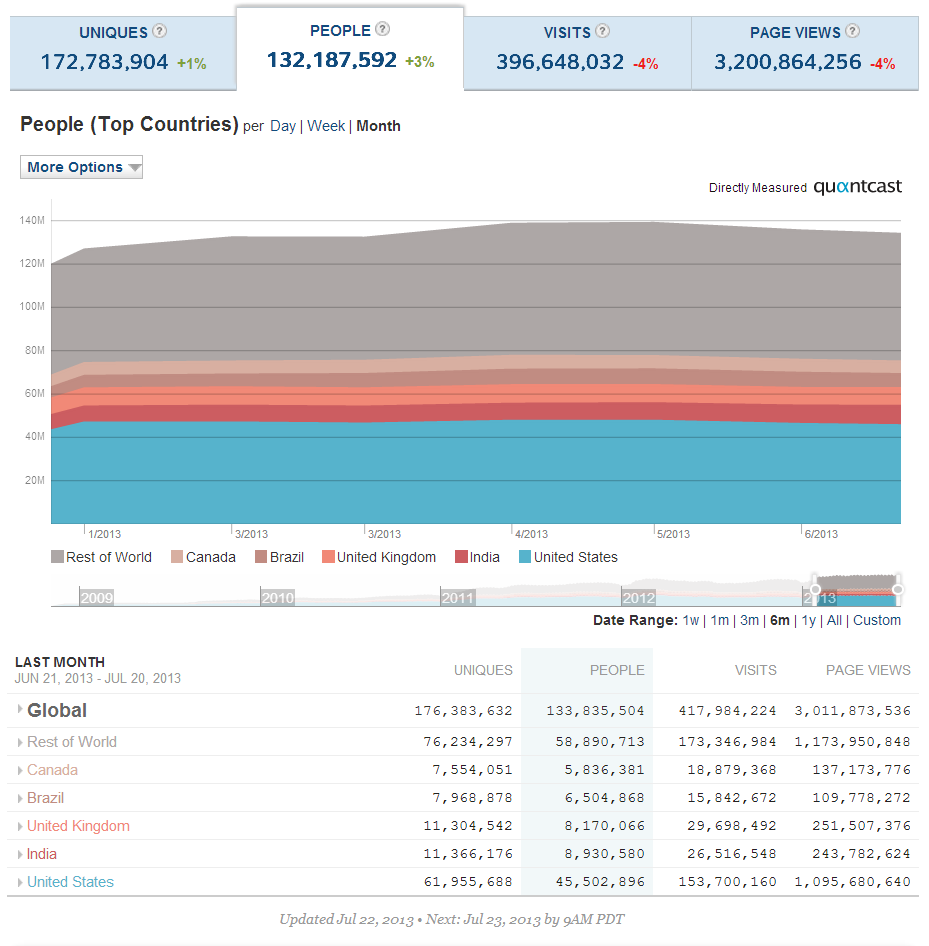
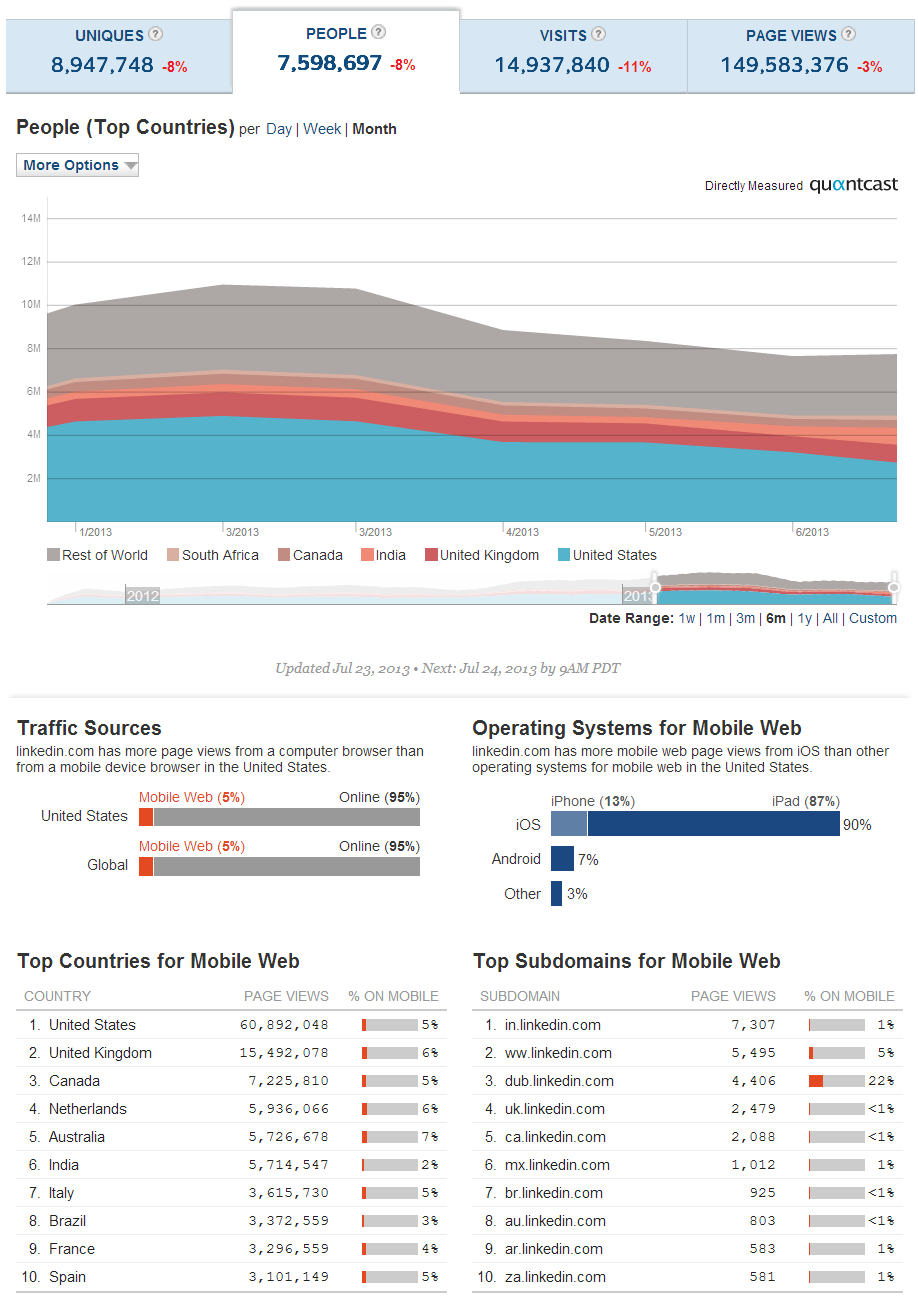
LinkedIn Global Monthly Visitors
This chart shows the monthly global unique visitors to LinkedIn for the past 6 months (actual people – not cookies). Note that Quantcast claims they are the only measurement service that tells you the difference between cookies and people, which is important because a single person can be represented by many cookies (home, work, phone, different browsers).
What should stand out to you is that LinkedIn more than doubled in the number of people using their site globally on a monthly basis, from 45.8M in September 2010 to 94.3M in September 2011, and has added nearly 40M more people visiting LinkedIn on a monthly basis since September 2011.
Also, notice that in the top 5 countries, India has passed the U.K. for the #2 position and Canada is now back in the top 5 countries in terms of visitors to LinkedIn, bumping the Netherlands out of the top 5 from 2011.
2011 Data

2010 Data

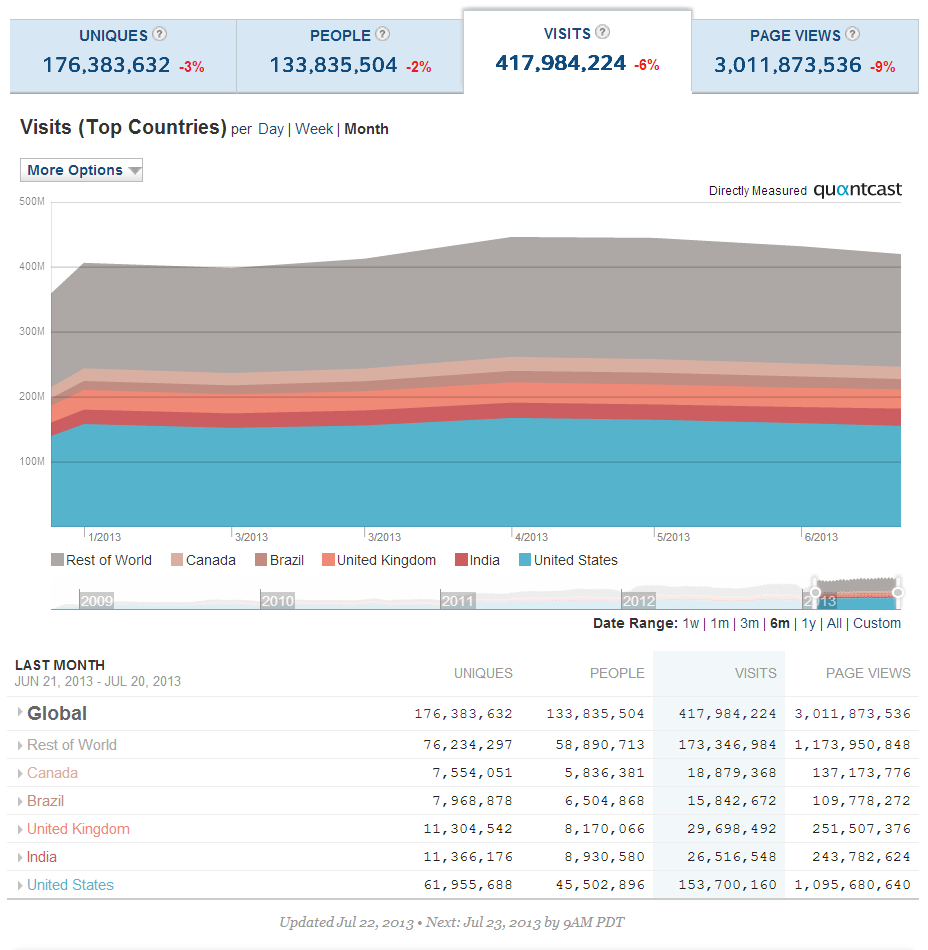
LinkedIn Global Monthly Visits
This chart shows the total number of individual sessions initiated by all of the visitors to LinkedIn on a monthly basis for the past 6 months.
While LinkedIn more than doubled the number of monthly visits from global users in 2011 over 2010, they were unable to achieve the same feat from 2011 to 2013. However, they were able to gain a massive 152,000,000 additional monthly visits globally.
When it comes to visits, the U.K. is #2 even though India has more people visiting LinkedIn. This means that a good number of folks in the U.K. are visiting LinkedIn more often and/or are visiting LinkedIn from multiple devices and/or browsers. The same appears to be true of Canada and Brazil – Brazil has more people visiting LinkedIn, but Canada drives significantly more visits.
2011 Data

2010 Data
 .
.
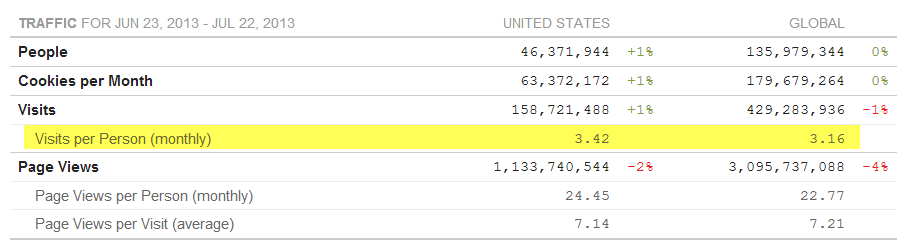
LinkedIn Monthly Visits Per Person
The most recent data from Quantcast shows that the average number of visits per person to LinkedIn is 3.42 per month for U.S. users, and 3.16 per month as a global average.
While those numbers may seem low, they are positive movements over 2010 and 2011, especially in the U.S., with a 20% increase.
2011 Data

2010 Data

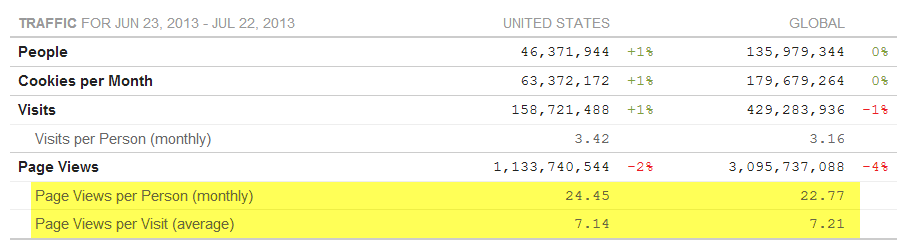
LinkedIn Monthly Page Views Per Person
Quantcast’s latest data for LinkedIn shows that monthly page-views per person is essentially flat for the U.S. compared to 2011 figures.
However, when comparing 2013 page views to 2010 figures, monthly page-views per person have seen a 13% decrease in the U.S. and a 22% decrease globally. Any thoughts as to why LinkedIn enjoyed stronger monthly page-views per person in 2010 (28.1 U.S., 29.2 Global)?
2011 Data

2010 Data

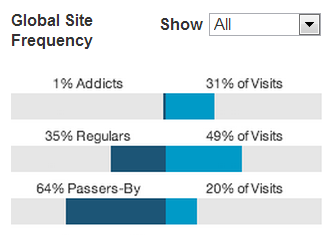
LinkedIn Global Traffic Frequency – Addicts Driving More Visits
Quantcast breaks down visitor traffic into three categories:
- Passers By, users who visit a site or interact with media once per month;
- Regulars, those who visit a site or interact with media more than once but less than 30 times per month;
- Addicts, those that interact with a site 30 or more times per month.
While the percentage of LinkedIn users categorized as Addicts, Regulars, and Passers-By was essentially the same in 2010 and 2011, since then, the percent of Addicts has increased from 25% of visits to 31% of visits, with corresponding and expected decreases in the percentage of Regulars and Passers-By.
While some would characterize the increase in and high percentage of LinkedIn “Addicts,” I think it’s normal and to be expected, as the “Addicts” are the power users who drive revenue and profits for LinkedIn (recruiters, HR professionals, salespeople, marketing professionals, etc.).
2011 Data

2010 Data

LinkedIn Mobile User and Traffic Data
Quantcast now quantifies mobile user traffic, and as you can see below, about 5% of all traffic to LinkedIn comes from a mobile device, the vast majority of it coming from iPad users.
I find it interesting that South Africa is in the top 5 countries in terms of people driving mobile traffic to LinkedIn given that South Africa doesn’t even show up in the top 10 countries for mobile page views.
When it comes to mobile page-views, the top 5 countries are the U.S., U.K., Canada, Netherlands, and Australia, respectively.
Take a look at LinkedIn’s top 10 subdomains for the mobile web – notice dub.linkedin.com?
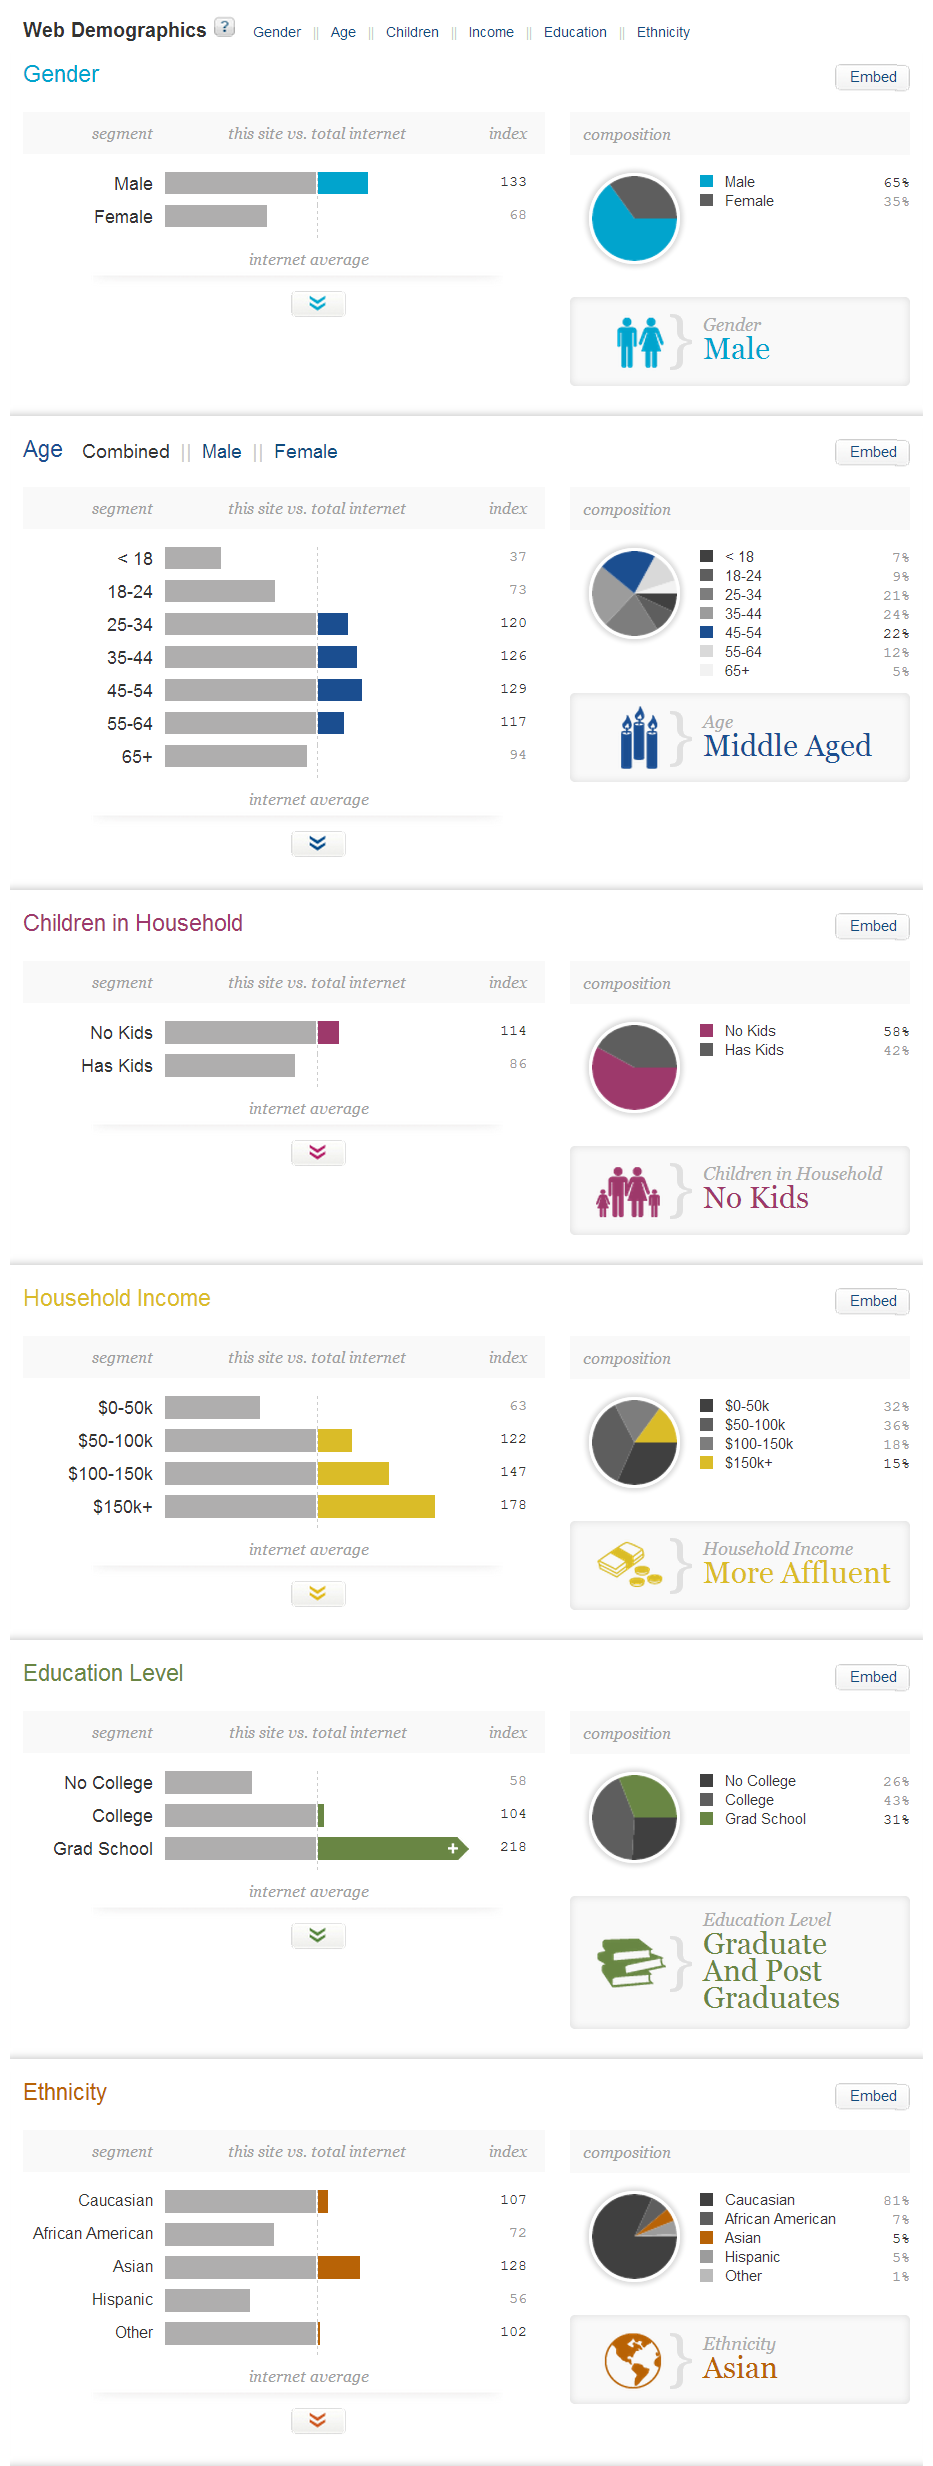
LinkedIn User Demographics
As a professional social networking site, the age, income, and college graduate/post graduate figures are pretty much where most people would expect them to be.
However, notice that while in 2011 there was a 51/49 male/female split, it is now now 65/35. I find that to be a surprisingly large shift in a short period of time!
With regard to ethnicity, while African Americans and Hispanics are underrepresented on LinkedIn when compared to Internet averages, Asians are strongly represented and there has been an increase in Hispanic representation.
2011 Data

2010 Data

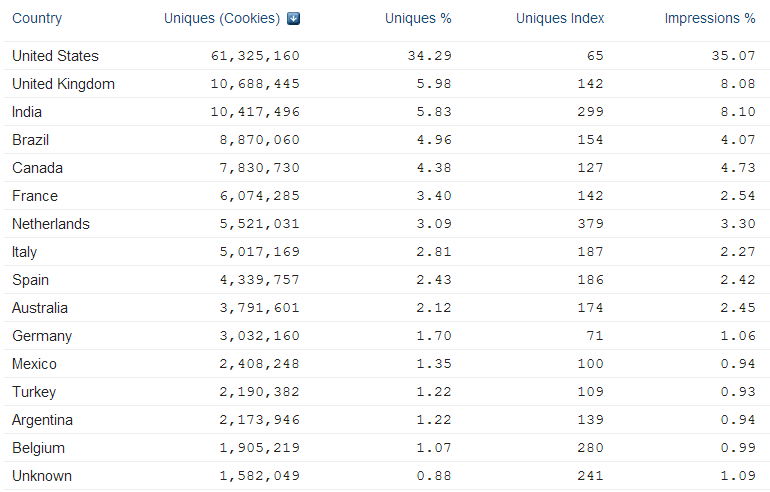
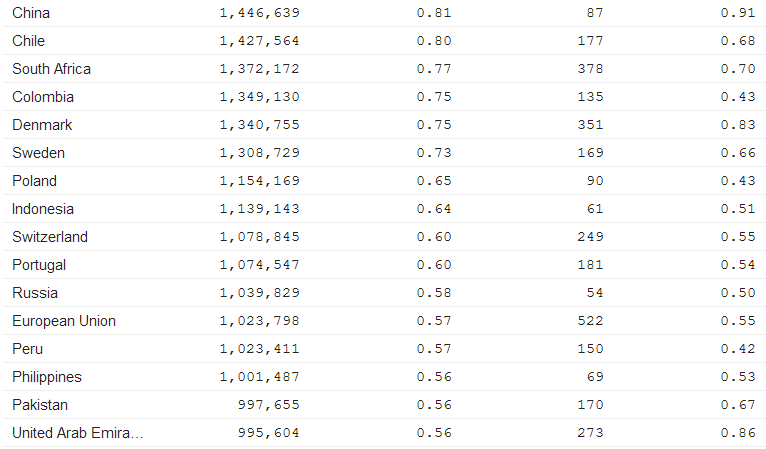
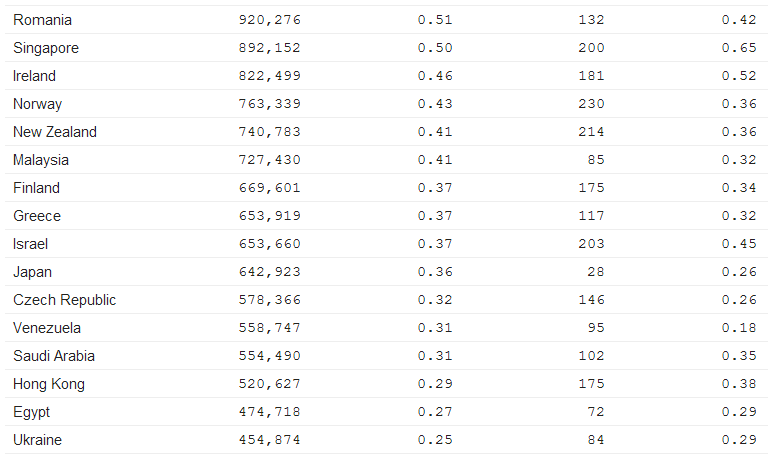
LinkedIn Monthly Visitors by Country
This chart shows the latest data (from July 2013) for the top 48 countries by number of LinkedIn visitors monthly by country – not the number of LinkedIn profiles per country.
Of note:
- The U.K. and India continue to battle over #2 and #3 and it’s getting tighter every year
- Canada and France have now surpassed the Netherlands, which used to be #4 in 2010 and #5 in 2011 (now #7 globally)
- Brazil more than quadrupled their monthly visitors to LinkedIn from 2010 to 2011 (0.9M to 4.9M), and have nearly doubled again from 2011 to 2013 (4.9M to 8.9M). Impressive!
- France has more than doubled their monthly visitors to LinkedIn (2.9M in 2011 to 6M in 2013)
- Italy and Spain have nearly doubled their monthly visitors (2.6M / 2.2M in 2011 to 5M / 4.3M in 2013, respectively) and Italy could pass the Netherlands by 2014
- Mexico and Turkey have also more than doubled their monthly visitors to LinkedIn from 2011 figures (1.1M / 0.9M in 2011 to 2.4M / 2.2M in 2013, respectively)
2011 Data


2010 Data


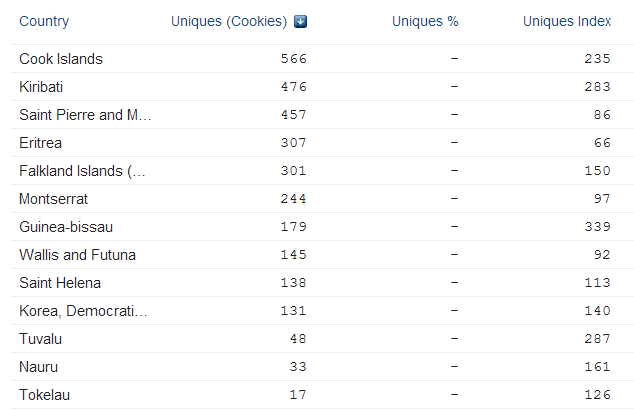
Being the curious guy that I am, I decided to see where the lowest number of monthly visitors to LinkedIn come from – see the list below.
I have to admit that I had to look up some of these places to see where they were.
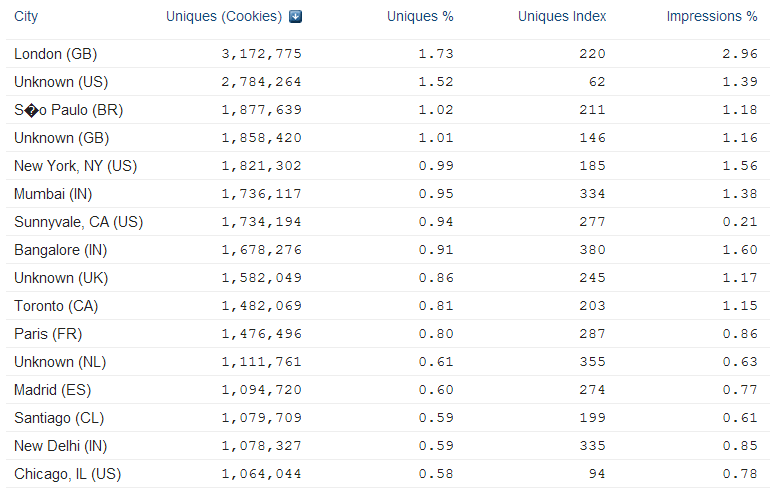
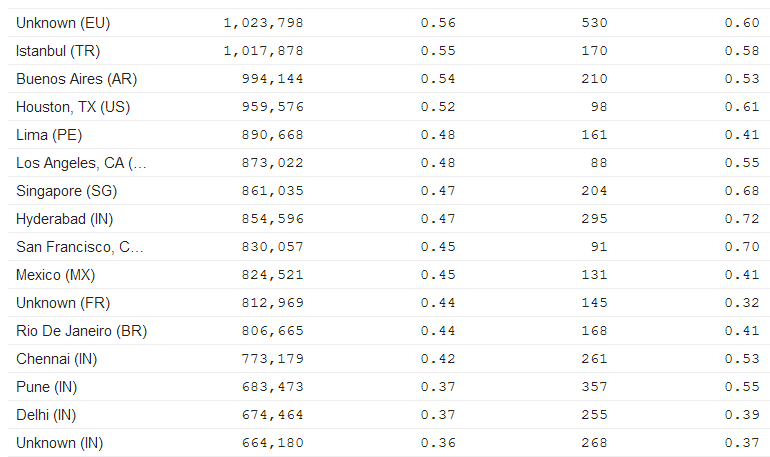
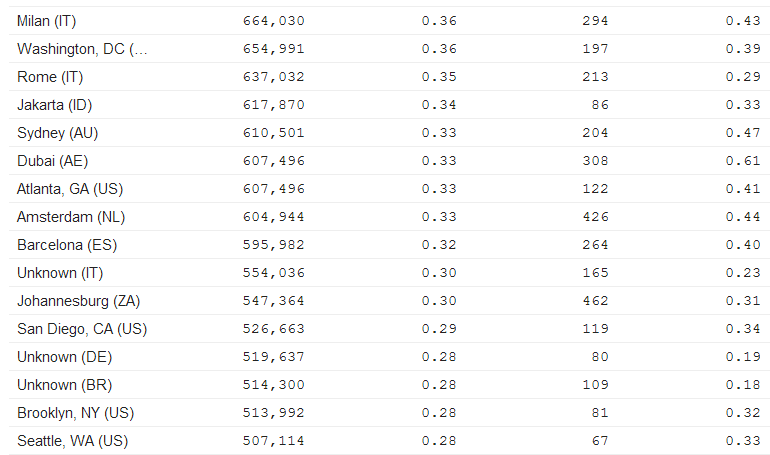
LinkedIn Visitors by City
This chart shows the latest data (from July 2013) for the top 48 cities from which visitors come to LinkedIn.
London is still the #1 city in the world in terms of visitors to LinkedIn and continues to widen its lead.
São Paulo is now the #2 city, with NYC coming in at #3 (not counting the “unknowns,” of course).
Furthermore, out of the top 10 cities, only 2 are from the United States, demonstrating how truly global LinkedIn is.
2011 Data


2010 Data


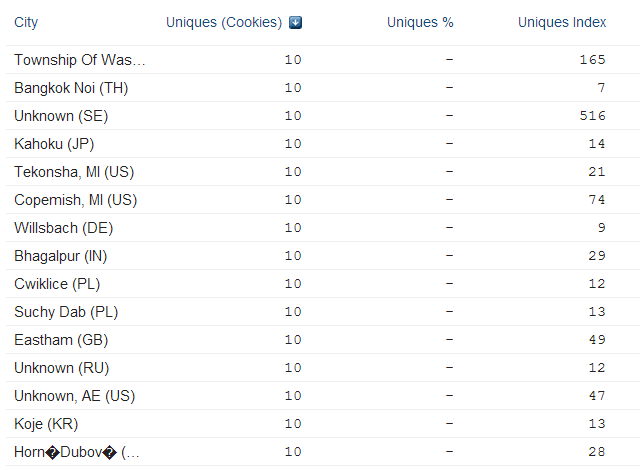
Just for fun, I decided to see what cities had the least number of visitors to LinkedIn.
After a ridiculous amount of clicking (I had to get to page 1,306 of the results), here they are:
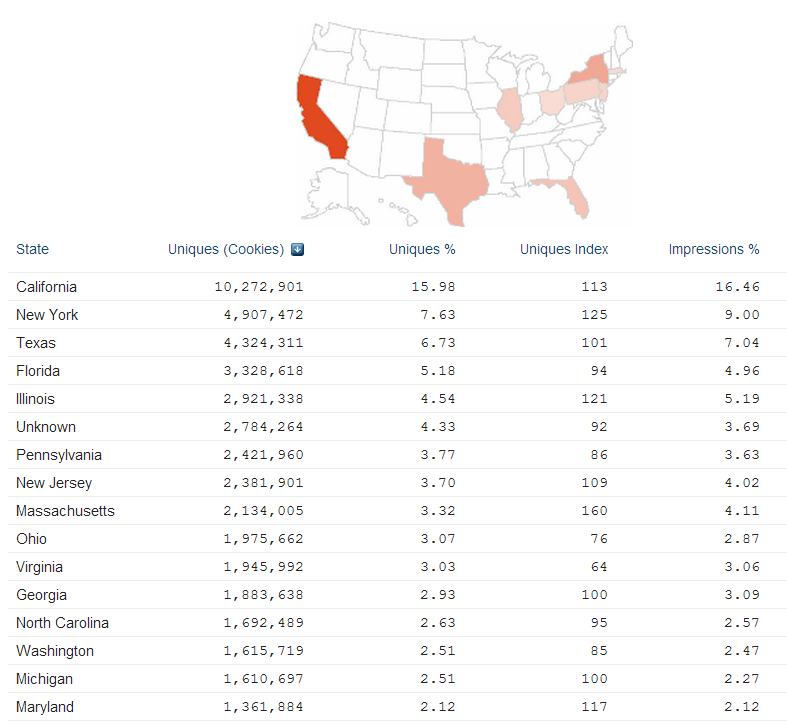
LinkedIn U.S. Monthly Visitors By State
Unexpectedly, California dominates the state ranking by a wide margin at more than double New York.
Spotting movements in the top of the list, I noticed that Florida finally passed Illinois, and Massachusetts, Ohio and Virginia have passed Georgia.
If you were curious, Wyoming still has the least number of monthly visitors to LinkedIn out of all 50 states (sorry Wyoming).
2011 Data

2010 Data
")
Please Share!
I hope you found the LinkedIn traffic, mobile data and visitor demographics and data interesting!
If you did, please share this post with anyone you think would benefit.
If you haven’t already, I recommend you investigate other sites using Quantcast, even if the sites aren’t directly measured. For example – check out Quantcast’s estimated user demographics and visitor statistics for Facebook and Twitter.
Although only estimated data, the information is still quite interesting!