 Have you ever wondered:
- How many resumes, social profiles, names, etc., you have to identify to result in 1 hire?
- How efficient your sourcing/recruiting/hiring process is?
- How many candidates you need to submit to fill your position?
- How more effective messaging/engagement strategies and tactics can measurably improve your efficiency?
- How wonderful it would be if you could educate your hiring manager/team on exactly how much effort goes into producing 1 hire, and the effects of a poor assessment/hiring process?
- The # of hires per month a sourcer/recruiter can affect per month based on their daily activity?
- How many sourcers/recruiters you need to achieve a target # of hires per month?
If you answered “Yes!” to any of the above, you’re in luck, because I’ve whipped up a couple of candidate funnel and sourcing team calculators that can help you answer those questions and more.
Candidate Sourcing Funnel Calculators
You can grab a copy of the file here or simply click the image below:
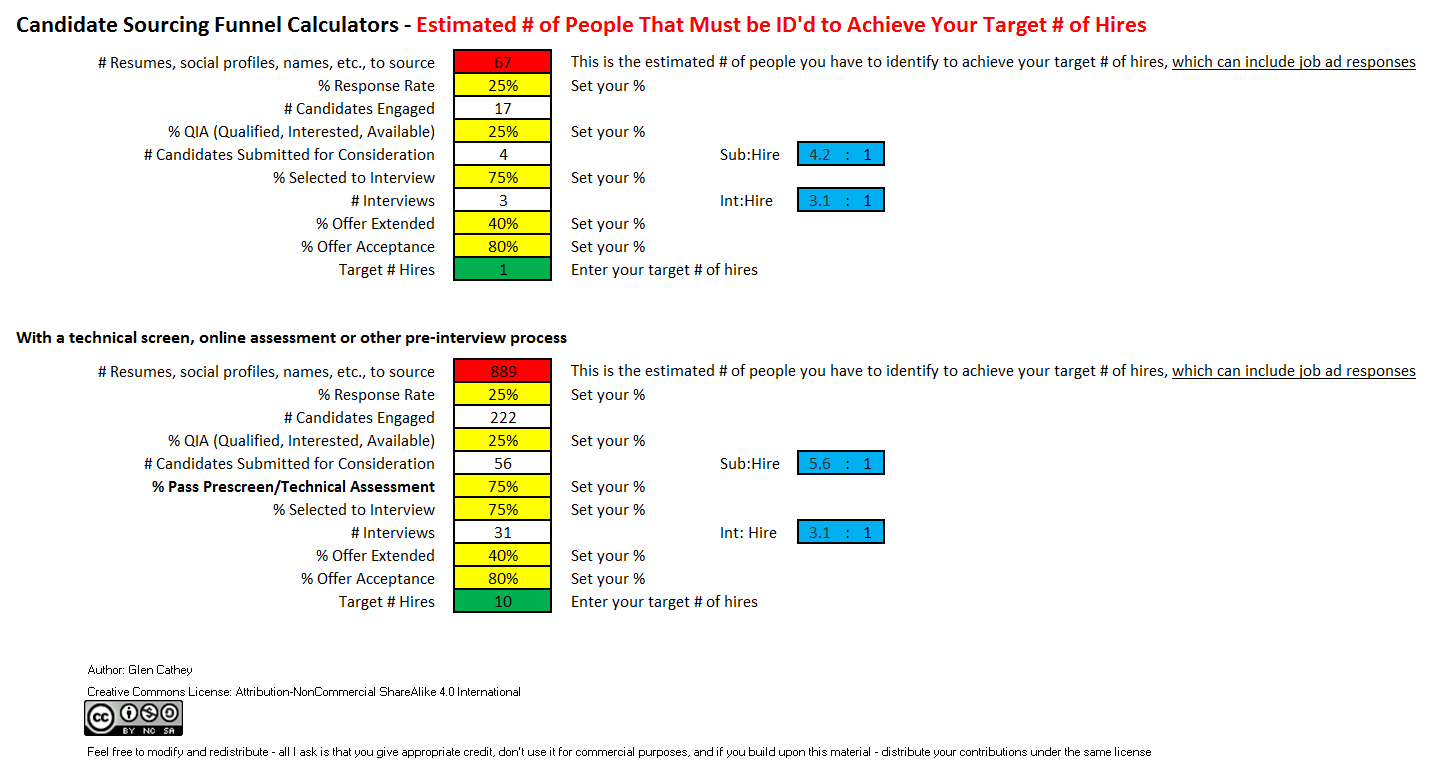
By entering your target # of hires and setting your percentages/conversion ratios at each step of the funnel, you can see the estimated number of people you would have to identify in order to achieve your hiring goal, as well as the estimated number of people you will actually talk to and submit for consideration, and the number of interviews that would need to take place.
As you could imagine, this data can be used to manage expectations of hiring teams, because in some scenarios, the local talent pool might not be big enough (i.e., there may not be 67 local Mandarin speaking Ruby developers). :)
If you’re not doing so already, I highly recommend you start to measure the following per job, hiring manager, group/division, skillset, etc.:
- Response rates
- % of people who are QIA out of those who are successfully contacted
- % of candidates who pass prescreens (if any are used – e.g., technical, online assessments, etc.)
- % of candidates selected to interview
- % of candidates who receive an offer after interviewing
- % of people who accept their offer (and actually show up!)
If you’re measuring these data points, you can add them to your candidate funnel calculator to much more accurately predict how many people you will need to identify and submit in order to produce a hire.
More importantly, these data points can help you identify constraints/challenges in your candidate sourcing and recruitment process and you can work with your hiring teams to try to improve the conversion ratios at each step of the funnel. For example:
Response Rates
You could try to affect a higher response rate from potential candidates by working with the hiring team to create compelling descriptions of the work, team and environment, incorporate sound bites & testimonials from existing employees, and even leverage members of the hiring team to reach out to potential candidates. Higher response rates can drastically effect the candidate sourcing funnel, reducing the # of people that must be identified to achieve the target # of hires. Keeping everything else the same as the above sourcing funnel, simply changing the response rate from 25% to 40% can reduce the # of people needed to be identified from 67 to 42. If you could achieve a 75% response ratio, you’d only have to identify 22 people.
Submittal to Interview Ratio
If the % of candidates submitted that are selected to interview is lower than 100%, there could be a number of contributing factors to explore, such as:
- The sourcers/recruiters don’t fully understand the position they are working on and the manager/group they are supporting and what entails the right match
- The sourcers/recruiters are not doing a good enough job of packaging up their candidate submittals so that the hiring team can see them for the matches that they really are
- The hiring team is being too picky and judging candidates on their resumes alone
- The hiring team doesn’t really know what they are looking for (unfortunately, this happens too frequently!)
Prescreen
If the data shows that a relatively small % of people pass the prescreen, it might indicate that the prescreen is poorly designed, with either a poor user experience (I had a situation where the prescreen was so long and laborious people would simply abort and withdraw) and/or it is not an accurate way of determining candidacy.
Offer Acceptance
If the data shows a relatively low offer acceptance ratio, you should work with your hiring team to perform a root cause analysis, including following up with the people who have rejected offers to find out why and work with the hiring team to see if you can address any patterns (e.g., lower than market compensation, poor interview process, work seemed boring, etc.).
Local Talent Pool
Even with high conversion ratios all along the funnel, the number of estimated people that must be identified to produce the target # of hires might end up being an unrealistically high number depending on the requirements of the hiring team, and leveraging the data can foster a collaborative conversation on alternatives, such as opening up the search to non-local candidates, reducing some of the hiring requirements (e.g., the local talent pool for mobile application software engineers with ecommerce experience is small – the hiring team may decide that ecommerce experience isn’t actually necessary, opening up the local talent pool), etc.
Of course, you can build upon these calculators and to mirror your specific processes, as well as measure and model things such as % candidates submitted by sourcers that are “accepted” by the recruiters as viable, candidate:applicant conversion ratios, withdrawals, no shows (interviews and/or day 1 walk on), etc. Feel free to modify/build upon what’s already there to better suit your specific needs.
NOTE: You may notice some funny looking numbers showing up in the calculators at times (e.g., 75% of 2 isn’t 1), and this will be due to the fact that I formatted some cells to only display whole numbers (# candidates engaged, submitted, selected for interview, etc.). Feel free to reformat those cells to show 1 or 2 decimal places if you don’t mind seeing fractional numbers in those areas, although I do hope you realize fractional people don’t exist. :)
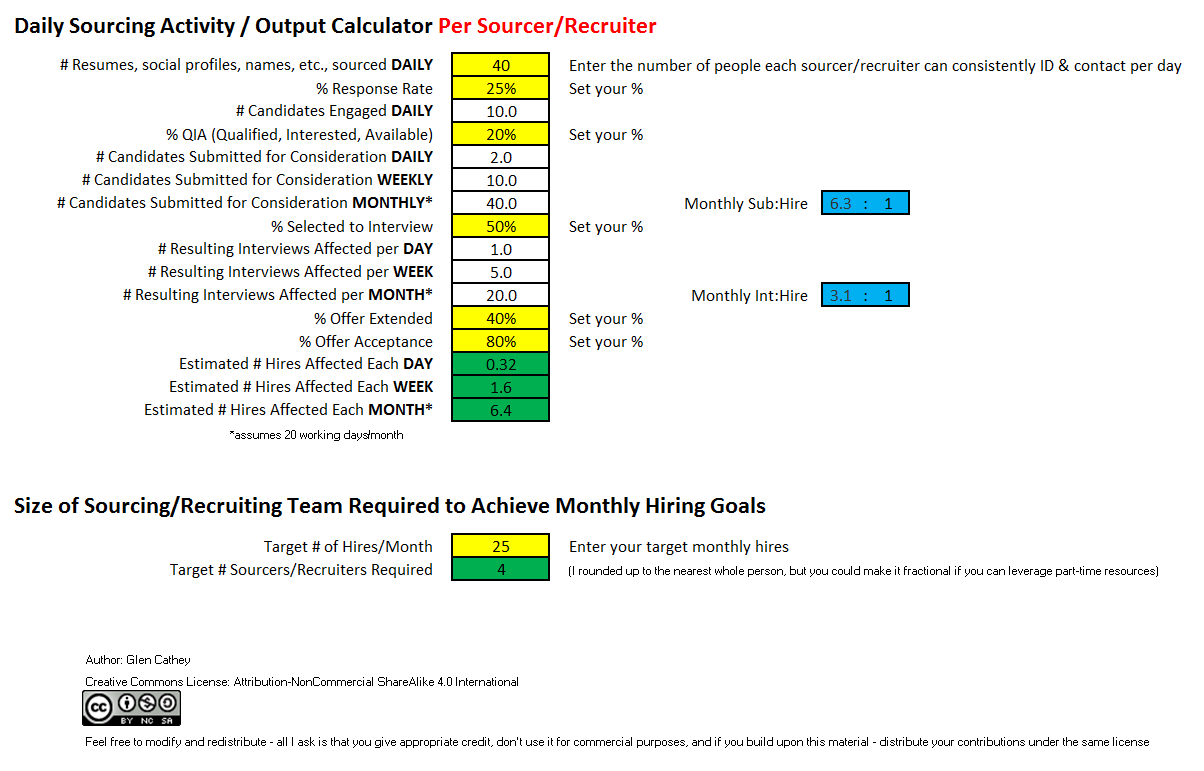
Sourcing/Recruiting Team Output Calculator & Team Estimator
On the second worksheet of the file above you will find a sourcing/recruiting team output calculator. Once you enter the number of people each sourcer/recruiter can consistently find/identify per day, the calculator will estimate the number of candidates engaged daily and the number of candidate submittals, interviews and hires affected daily, weekly and monthly per sourcer/recruiter.
You can also enter your target # of hires per month to estimate the # of sourcers/recruiters you will need to achieve your monthly hiring goal.
What Do You Think?
Let me know if you find these calculators helpful, and don’t hesitate to let me know if you find any glitches I need to fix or if you have suggestions for improving them.
Thanks!